You sent a presentation to a client, an investor or your manager — and heard nothing back. Did they read it and are thinking it over? Or never open it at all? An email attachment can't answer that. Here are the ways to find out, which numbers to look at and how to avoid crossing the line into surveillance.
Why a file can't tell you
A PDF or PowerPoint file downloaded from an email lives on someone else's computer and reports nothing back to you. Email read receipts don't help much either: the recipient can decline to send them, and even when one arrives, it only says the email was opened — not the presentation.
That leaves two options: ask directly, or send a link to a page that counts views instead of a file.
Three ways to find out
| Method | What you learn | Limitations |
|---|---|---|
| Ask | Whatever they tell you | Awkward, and the answer isn't always accurate |
| A link to a page with view stats | Whether it was opened, how often, how far people got, how long they looked | Aggregate numbers, no names |
| A link that asks viewers to introduce themselves | Who exactly opened it and how long they looked | Some people will close the page rather than type an email |
A link beats a file for another reason too: you can update it after sending — fix a typo or a number — and the recipient sees the new version.
Which numbers to look at
- Views — how many times the page was opened. One person can open it three times.
- Viewers — how many different people, approximately: without sign-up, a service can only recognize a viewer by indirect signals.
- Average view — how long people spend on the page on average.
- Read to the end — what share of views reached the last slide.
- By slide — how many viewers reached each slide, how long they stayed and where they leave most often.
- Sources — where people came from: email, a messenger, a website or a direct visit.
- Devices and countries — phone or computer, and where from.
How to read these numbers
Small numbers aren't statistics. If you sent the presentation to three people, five views might be one person opening it on a phone and then on a laptop. Draw conclusions from trends, not from a single day.
A long time on a slide isn't always interest. People linger on a table because it takes time to read. On a slide with one sentence, a long pause may mean the idea isn't clear. Compare the time with how much is on the slide.
Look where people leave. If half the viewers drop off on one slide, check that slide and the one before it: too long, unclear — or the person found what they came for, the price for example. That's a reason to rewrite the slide or move the important part earlier.
Lots of phones? Check the mobile view. Links from messengers are often opened on the go. If the phone share is high, look at the presentation on a phone yourself: is the text readable, are the tables too small?
Bots and link previews. Messengers and email services open a link themselves to build a preview card with an image. Good analytics doesn't count those, otherwise every link pasted into a chat would show up as a “view”.
Viewers are people too
Knowing that a presentation was opened and how far people read is fine: these are aggregate numbers that identify no one. Knowing who exactly viewed it is different, and it's fairer when the person knows: they entered their email themselves and saw that the author would see it.
And don't quote someone's own statistics back to them. “I see you spent three minutes on the pricing slide” sounds like surveillance. Just open the conversation with pricing — you already know it matters to them.
How to do it in JamPres
Publish the presentation and send the link — every view goes into analytics. On the presentation page, the “Overview” tab shows views in the last 30 days; the details are on the “Analytics” tab.
What is and isn't counted:
- your own views while you're signed in aren't counted, and neither are bots and link previews;
- viewers get no cookies and nothing is stored in their browser: a viewer is counted by a daily hash, and IP addresses aren't stored;
- that's why unique viewers are counted within a day — someone who opens the link on Monday and again on Wednesday counts as two viewers.
How much you see depends on the plan of the presentation's owner:
| Plan | What analytics shows | History |
|---|---|---|
| Free | View counter and views by day | 30 days |
| Base | Plus viewers, average view, “Read to the end”, “How far they get” by slide, sources, devices and countries | 12 months |
| Pro | Everything in Base plus “Export CSV” | 24 months |
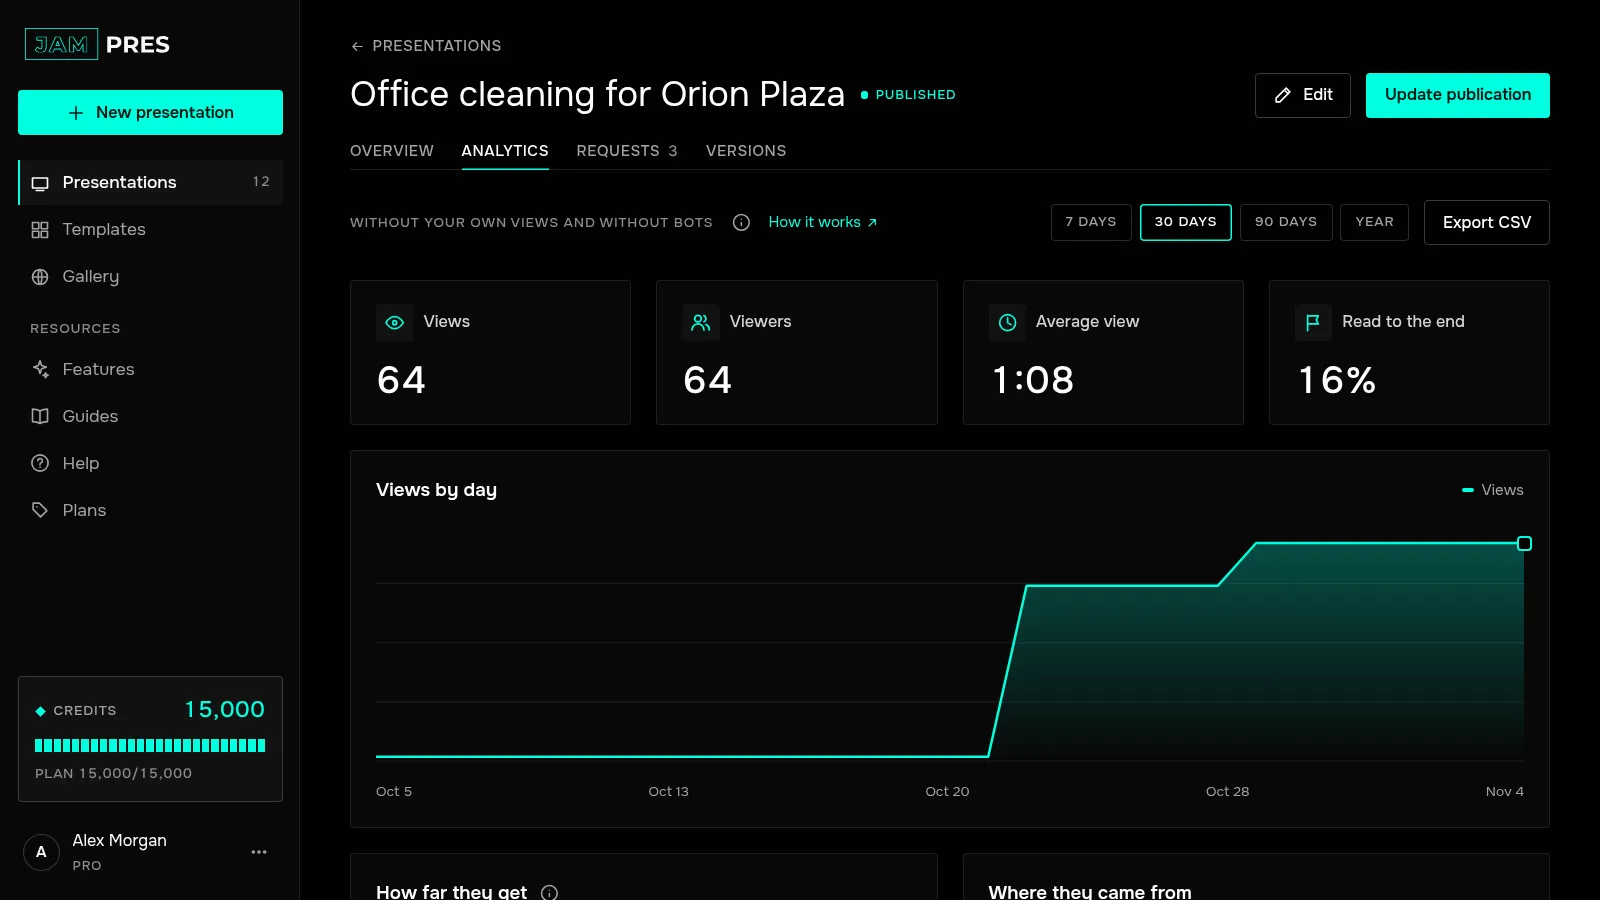
To see names, choose “Email” under “Who can open it” — that's from the Base plan. The viewer sees “The author asks you to introduce yourself” and a note that the author will see their email; the name is optional. The address isn't verified: it's an introduction, not a sign-in. A “Who viewed” section then appears in “Analytics”, with the email, visits, time and how far the person got. If a viewer asks, you can delete them, and their views stay anonymous.
You don't need to check the dashboard every hour: the email “Your presentation was opened N times” arrives a few hours after the first views, then at most once a week while people keep viewing. You can turn it off in your account settings. If you publish the presentation as a website, analytics also shows “How far they scroll the website”, section by section — also from the Base plan.
Analytics works with every template — here are a few that read well when a presentation is sent as a link:
Publish your presentation, send the link — and you'll know whether it was opened and how far people read.
About analytics in JamPres